
The best one-line answer to this comparison already exists, from developer educator Steve Kinney: "Playwright drives. Chrome DevTools debugs. Pick on the verb, not the brand."
That's genuinely the whole decision. What's left is knowing which of your tasks are driving and which are debugging, because a few (like "check why this page is slow after login") look like one and are actually the other.
Here's the split with specifics: what each MCP uniquely owns, the numbers behind the token difference, how to run both without bloating your context, and the one capability neither has.
What's the actual division of labor?
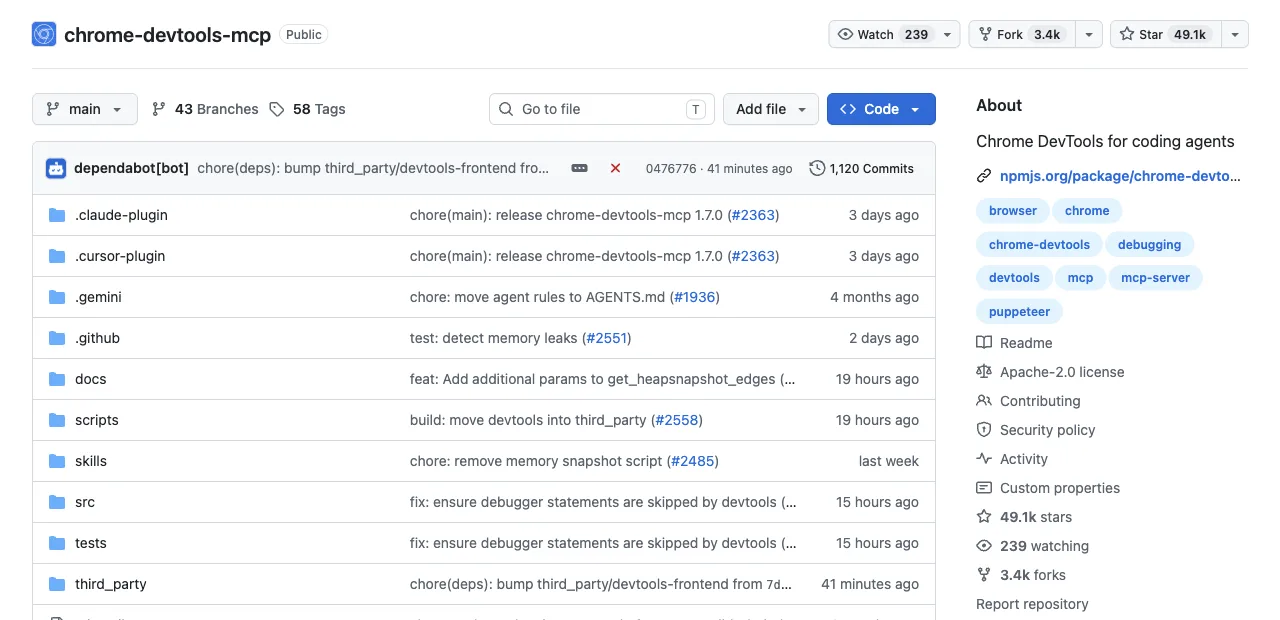
Both are official, free MCP servers that let your agent control Chrome. The design centers differ: Chrome DevTools MCP (shipped by Google, now at v1.7.0) wraps the DevTools protocol's diagnostic surface, while Playwright MCP wraps Playwright's operation surface. Read the table by task, not by product loyalty.
| Your task | Use | Why |
|---|---|---|
| Why is this page slow? (LCP, INP, CLS) | DevTools MCP | Performance tracing is its exclusive; Playwright MCP has no profiling at all |
| Find the memory leak / inspect console errors | DevTools MCP | Heap snapshots and source-mapped console are DevTools-panel features |
| Fill forms, navigate flows, scrape a list | Playwright MCP | Accessibility-tree refs make repeated operations deterministic |
| Test on Firefox, WebKit, or Edge | Playwright MCP | DevTools MCP is Chrome-only by construction |
| Daily tasks on your logged-in accounts, without losing your window | Neither, cleanly | See the last section; this is the gap both leave open |
Verb first, brand second, every time.
One more framing note before the details: both servers are free and officially maintained, so this isn't a budget decision. The only real cost of choosing wrong is context, because every registered tool schema and every response payload lands in your agent's window, and the two servers spend that budget very differently.
Which debugging tasks does DevTools MCP own?
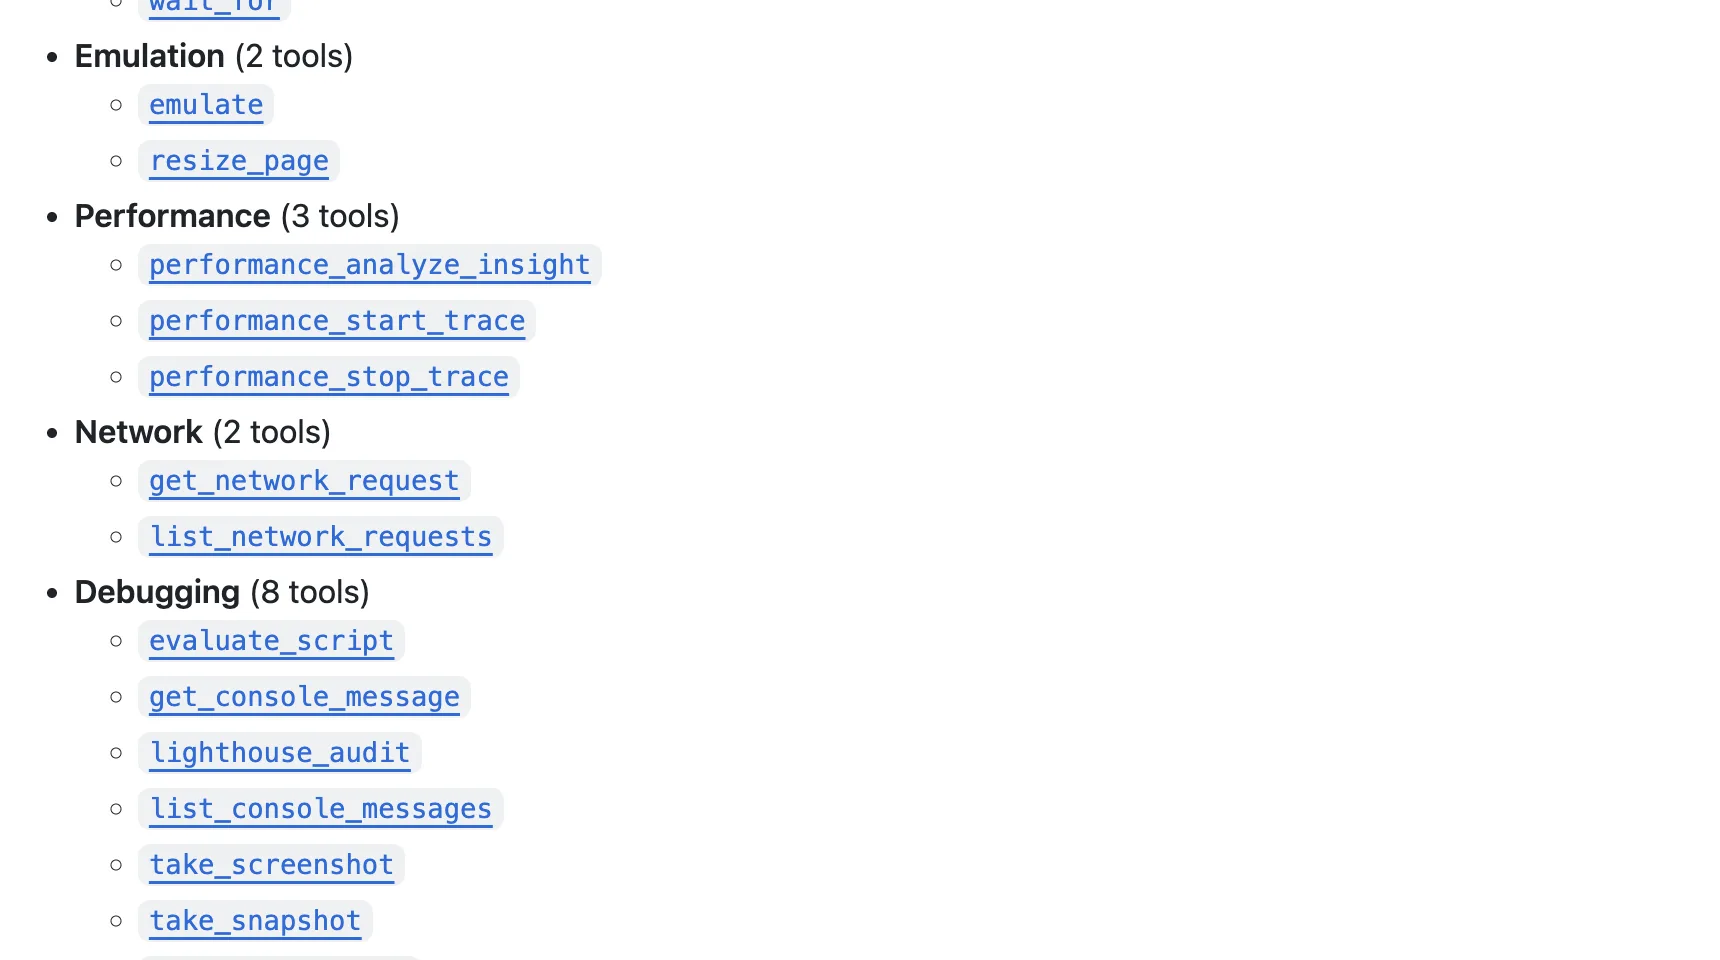
Three examples where DevTools MCP does things Playwright MCP simply has no tools for.
1. Performance investigation. performance_start_trace and performance_stop_trace capture a real trace with Core Web Vitals (LCP, INP, CLS), and performance_analyze_insight drills into named findings like LCPBreakdown, the same engine as the DevTools Performance panel. Your agent can answer "what exactly is delaying LCP" with data, not guesses.
2. Memory leaks. take_heapsnapshot produces standard V8 .heapsnapshot files, and v1.7.0 expanded the heap analysis toolkit substantially: dedicated tools for duplicate strings, object dominators, retaining paths, heap snapshot comparison, and edge traversal. Nothing in Playwright MCP's toolbox touches heap analysis.
3. Network forensics and emulation. Requests stay inspectable across the last 3 navigations, large response bodies spill to disk instead of into your context, and a single emulate tool covers CPU throttling, network presets from Slow 3G to offline, viewports, user agents, and color scheme. "Does checkout survive a flaky connection on a mid-range phone" becomes one prompt.
One boundary to know: its lighthouse_audit covers accessibility, SEO, and best practices, and explicitly excludes performance scoring; traces are the performance path.
Which driving tasks does Playwright MCP own?
Three examples in the other direction, plus the token numbers that come with them.
1. Deterministic multi-step operation. Snapshots label every element with a stable ref (ref=e5), so "fill the shipping form and submit" resolves to exact targets, repeatably. This is the mechanism DevTools MCP's input tools don't provide with the same rigor.
2. Cross-browser flows. --browser=firefox, webkit, or msedge runs the same task across engines. DevTools MCP supports Chrome and Chrome for Testing, full stop.
3. State setup for tests. Storage state save and restore lets an agent bottle a session and reuse it across runs, plus browser_run_code_unsafe as an escape hatch into raw Playwright when a task outgrows the tool menu (the _unsafe suffix is the tool's real name, not our editorializing).
The token asymmetry runs through everything: the February 2026 three-tool test put it as DevTools MCP returning targeted responses while "Playwright sends everything." Playwright MCP's full-snapshot habit is what makes it deterministic, and also what makes long sessions expensive; if that's your pain, the token problem breakdown covers the escape routes.
Here's that cost measured directly instead of quoted secondhand: a real take_snapshot call, from a recorded session through the actual mcp Python SDK against chrome-devtools-mcp@latest, against a plain logged-out page (Hacker News' front page, about 30 links).
await session.call_tool("take_snapshot", {})

navigate_page chars: 123
take_snapshot chars: 38285
## Latest page snapshot
uid=1_0 RootWebArea "Hacker News" url="https://news.ycombinator.com/"
  uid=1_1 link url="https://news.ycombinator.com/"
  uid=1_2 link "Hacker News" url="https://news.ycombinator.com/news"
    uid=1_3 StaticText "Hacker News"
  uid=1_4 link "new" url="https://news.ycombinator.com/newest"
    uid=1_5 StaticText "new"
  uid=1_6 StaticText " | "
  uid=1_7 link "past" url="https://news.ycombinator.com/front"
    uid=1_8 StaticText "past"
  uid=1_9 StaticText " | "
  uid=1_10 link "comments" url="https://news.ycombinator.com/newcomments"
    uid=1_11 StaticText "comments"
  uid=1_12 StaticText " | "
  uid=1_13 link "ask" url="https://news.ycombinator.com/ask"
...
38,285 characters, roughly 9-10K tokens, for one snapshot of a simple page. That's the same full-accessibility-tree mechanism Playwright MCP's snapshot leans on for its own refs, which is why the size argument in this article isn't a vendor claim, it's what the format costs by construction. For comparison, a targeted extraction of the same page (raw Playwright, no MCP layer, from the same recorded session set) came back at about 120 characters:
{'title': 'Hacker News', 'url': 'https://news.ycombinator.com/', 'topStory': 'Qwen 3.8 27B', 'points': '414 points'}
elapsed_s: 1.8
Per-call size is one lens. The other is what a whole task costs once failures are priced in, and Real-World Bench measured that across a 31-task suite against live sites with the same model (gpt-5.6-sol, max effort) and the same independent judge. One annotation before the numbers: neither MCP server was the measured tool. The benchmark ran the two official CLI siblings, chrome-devtools-cli and playwright-cli, which are the closest measured proxies for these routes. chrome-devtools-cli finished 61.3% of 31 tasks perfectly at $4.95 average model cost per task; you pay for the misses too, so that is $4.95 ÷ 61.3% = $8.08 per completed task, the highest of the five tools measured. playwright-cli finished 71.0% across 31 tasks: $3.42 ÷ 71.0% = $4.82. ego (lite) finished 93.5% across 31 tasks: $1.64 ÷ 93.5% = $1.75.
Real-World Bench: cost per completed task (lower is better)
Avg model cost per task ÷ perfect completion rate. Same model (gpt-5.6-sol, max effort), same judge, best round each, run 2026-08-19
Read that result through the verb split and it stops being surprising: the DevTools surface was built for diagnosis, so paying the most per completed operation task is the expected price of driving with a debugger. The number doesn't dent its trace and heap tools at all; it just marks the boundary of what they're for.
How do you keep browser MCP snapshots from overflowing context?
Treat a snapshot as an observation budget, not a transcript of the whole page. Ask for the smallest region or state that answers the question, extract a few fields into a structured result, and avoid repeating the same snapshot after every click. DevTools MCP can return targeted diagnostics and spill large bodies to disk; Playwright MCP's accessibility tree is useful for refs but can become expensive on large pages.
Set tool capabilities deliberately, keep optional diagnostics disabled until needed, and move loops over known rows into code. Log input and output tokens plus the page and action that caused a large response, so a context overflow becomes a measurable boundary rather than a vague model failure.
Why can browser MCP performance degrade on macOS?
Startup and interaction slowdowns usually come from too many tabs, multiple browser processes, large traces, or a Chrome instance already under load—not from the MCP label itself. Measure launch time, active tabs, memory, CPU, and per-call latency separately, then close idle contexts and cap parallel work before changing tools.
If Chrome is already running, choose an explicit attach or isolated launch mode and confirm which profile owns the tab. Keep traces and screenshots bounded, and stop a task that begins thrashing instead of letting an agent open more tabs to compensate. A small reproducible profile is easier to diagnose than a shared desktop session.
What is a lightweight browser MCP setup?
A lightweight setup starts one MCP server with only the capabilities the task needs, launches one browser context, and keeps the browser lifecycle outside unrelated agent sessions. DevTools MCP's slim mode and Playwright MCP capability flags are useful patterns: fewer registered tools reduce discovery and context overhead, while an external browser avoids forcing every client to download a second stack.
Pin package and browser versions in CI, record the exact command, and test the server over its configured transport before adding an agent. For a local logged-in workflow, a user-controlled browser can be simpler than exporting cookies; for a clean test, an isolated context is safer and more reproducible.
How do you hand browser console and network evidence to a coding agent?
Give the agent a small evidence bundle: the failing URL, exact user action, console error with timestamp, request method and status, a sanitized response excerpt, and a trace or screenshot when layout matters. Ask it to form a hypothesis and name the next check before it edits code; raw logs without scope invite irrelevant fixes.
Use DevTools MCP for traces, heap, console, and network inspection, then use Playwright MCP to reproduce the flow and verify the fix. Redact cookies, authorization headers, personal data, and secrets before passing evidence to an external model, and keep the browser allowlist limited to the staging or test origin.
How should an agent fill complex React forms?
Fill a React form by logical group, then verify the application's state and validation message before moving on. Prefer accessible labels and roles, wait for the field to be enabled after a render, and confirm that controlled inputs contain the intended value rather than assuming a keystroke succeeded.
Dismiss or accept cookie overlays through their visible controls; do not click through an overlay with coordinates or hidden JavaScript. Keep submit behind a confirmation for real accounts, and capture the DOM, console, and network evidence if an event handler or client-side validation does not fire.
How do you make logged-in SaaS automation reliable?
Use a browser session that you authenticated normally, verify the account and origin before each sensitive action, and treat a redirect to login or a 401 as a human re-authentication checkpoint. Do not paste passwords, cookies, or bearer tokens into an MCP prompt, and protect any storage-state file as a credential.
If the SaaS exposes an approved API, prefer it for bulk reads and writes; browser automation is for the visible workflow the API does not cover. Keep private actions scoped to the named site, log what changed, and leave payment, deletion, permission, and outbound-message steps for explicit approval.
Should browser automation use the DOM or screenshots?
Use DOM or accessibility data when the task is semantic—find a labeled field, assert text, or extract a table—because it is compact and testable. Use a screenshot when the question is visual—alignment, clipping, canvas output, or a missing overlay—and pair it with DOM assertions when an action changes state.
Neither representation is complete. A page with missing ARIA labels can make an accessibility tree ambiguous, while a screenshot cannot prove hidden state or exact text. Ask for the representation that matches the claim, validate the result independently, and record when a visual or DOM limitation made the result uncertain.
Which browser MCP is best for QA on Next.js and Angular apps?
Use Playwright MCP for repeatable cross-browser flows, fixtures, and assertions; use Chrome DevTools MCP for diagnosing performance, console, memory, and network failures. A QA pass often uses both: reproduce with Playwright, inspect with DevTools, fix the application, then rerun the same deterministic test.
For Next.js or Angular, start with a small critical-path smoke test and add coverage where a regression is costly. Keep the model from declaring success: require a command exit code, visible assertion, and saved trace or screenshot for failures. Choose a Chrome extension only when the test genuinely needs a human's existing tab and profile.
Can you run both at once?
Yes, and lean is the way. Install both:
claude mcp add playwright -- npx @playwright/mcp@latest
claude mcp add chrome-devtools -- npx chrome-devtools-mcp@latest
Then control the context cost: DevTools MCP's --slim flag cuts it to 3 tools until you need the full diagnostic kit, and Playwright MCP's --caps flag gates optional tool groups (vision, pdf, devtools) behind opt-in.
Kinney's recommendation matches what we'd give: keep both configured but disabled by default, enable per task, "it's cheaper than being wrong." A sensible default is Playwright MCP for the driving work, switching to DevTools MCP when a task turns into a performance trace or a Lighthouse pass.
The masquerading tasks are where this pays off. "Check why the dashboard feels slow after login" reads like a driving task (navigate, log in, click around), and its payload is a debugging task (trace, then read the LCP breakdown). Run the navigation legs on whichever tool holds the session, then hand the diagnosis to DevTools MCP; splitting one prompt into those two legs is usually the difference between an answer and an afternoon.
What can neither of them give you?
An independent agent browser that carries your logged-in sessions. Playwright MCP launches its own fresh-profile browser: separate window, no cookies. DevTools MCP added --autoConnect (Chrome 144+), which attaches the agent to your current signed-in Chrome, but that puts human and agent in the same window, taking turns.
ego (lite) covers that combination. Your agent inherits your real signed-in state, and it runs in its own Space, so your tabs stay yours.
And the shortcoming, stated plainly: ego (lite) has no debugging panel. No performance traces, no heap snapshots, no Lighthouse. If your task is diagnosis, DevTools MCP keeps that job. Where ego (lite) fits instead is the daily logged-in operation work the two MCPs weren't shaped for: tasks behind SSO, 2FA or captchas, on a full Chromium that renders modern JavaScript apps, dynamic pages behind login walls, cross-origin iframes and shadow DOM.
See ego (lite) vs Playwright MCP in detail, or download ego (lite) for Mac and keep both MCPs for what they're best at. Free.
FAQ
Is Chrome DevTools MCP better than Playwright MCP?
Neither is better; they're split by job. DevTools MCP is the only one with performance traces, heap snapshots, and emulation; Playwright MCP is the only one with cross-browser support and deterministic operation refs. On end-to-end operation work, Real-World Bench's measured CLI siblings back the split: playwright-cli finished 71.0% of 31 tasks perfectly against chrome-devtools-cli's 61.3% across 31 tasks, so let the debugger debug. Most setups that need one eventually configure both.
Which uses fewer tokens?
DevTools MCP, generally: it returns targeted responses and writes large network bodies to disk, while Playwright MCP attaches full accessibility snapshots that reach 50K+ tokens on complex pages. Playwright MCP's --snapshot-mode and filename options narrow the gap if you configure them.
Can Chrome DevTools MCP use my logged-in browser?
Yes, via --autoConnect on Chrome 144+, which attaches the agent to the Chrome you're signed into. The cost is shared ownership: agent and human operate the same window, so it suits debugging sessions better than background tasks. For logged-in tasks that shouldn't occupy your window, ego (lite) is the fit: it imports your Chrome profile so the agent inherits your real sessions, and it runs those tasks in its own Space while your window stays yours.
Do they work with agents besides Claude Code?
Both are standard MCP servers, so Cursor, Codex, VS Code, and any MCP client can run them; swap the claude mcp add command for your client's config format.
If I only write tests, do I need DevTools MCP at all?
Not on day one: Playwright MCP plus your test framework covers authoring and running. It earns its slot the first time a test fails for a non-functional reason, a slow LCP, a memory creep, a request that only breaks on Slow 3G, because those diagnoses have no Playwright MCP tool. Install it lean with --slim and enable it when that day comes.